This post will go over various tools for retrieving memory and cache info in linux.
lstopo #
Let’s start with the output from lstopo. This is a tool that ‘shows the topology of a system’:
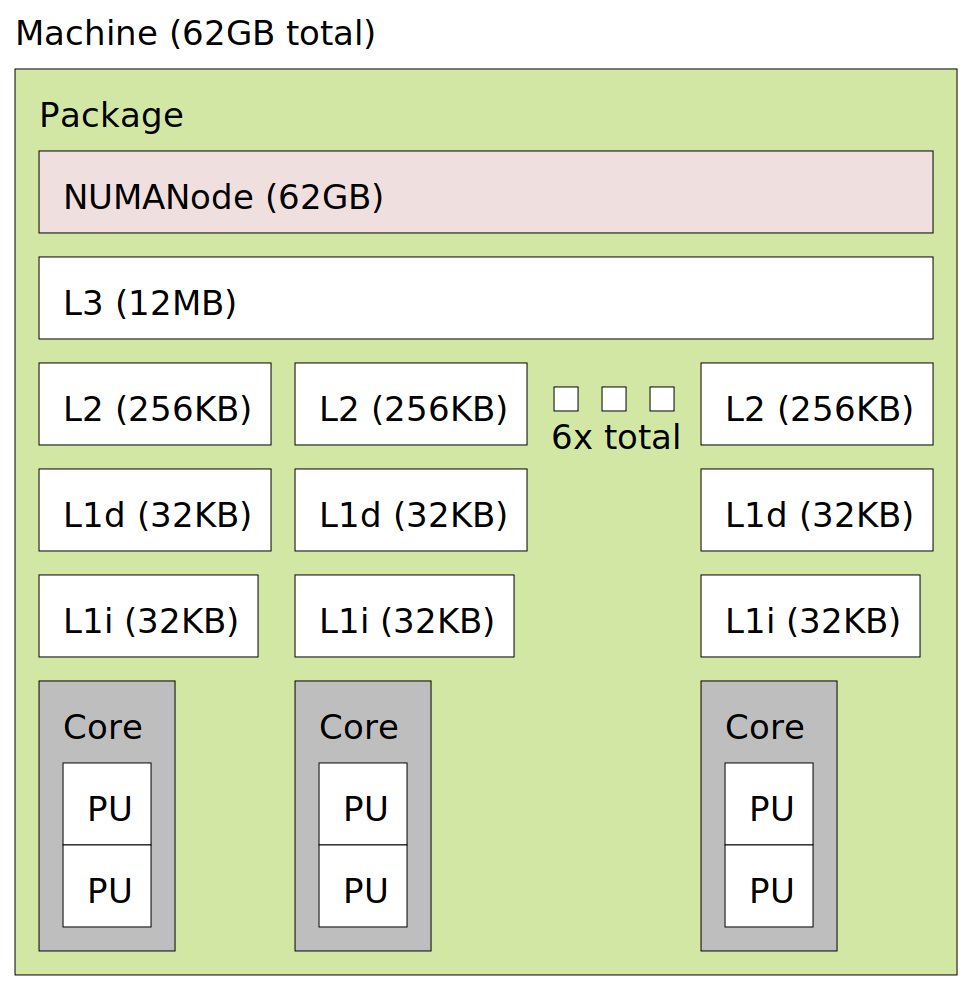
From the diagram:
- The main memory consists of 1 NUMA node of 62 GB
- There’s three levels of caching between the memory and the CPU
- At the first level (closest to the CPU), each core has a 32KB L1d cache and 32KB L1i cache
- At the second level, each core has a larger L2 256KB cache
- At the third level, the L3 cache is shared across all cores. It’s 12MB
- There are 6 cores in total
It’s worth briefly introducing what NUMA means. From wikipedia: “s a computer memory design used in multiprocessing, where the memory access time depends on the memory location relative to the processor”. In my case though, it’s not much of an issue since there’s only one NUMA node.
lstopo provides a brief overview, to get more details, we’ll need to use other
tools:
lscpu #
Next let’s use the lscpu command. Filtering out the output that’s not related to the memory system, I get the following:
> lscpu

Architecture:                       x86_64
Address sizes:                      39 bits physical, 48 bits virtual
NUMA node(s):                       1
L1d cache:                          192 KiB
L1i cache:                          192 KiB
L2 cache:                           1.5 MiB
L3 cache:                           12 MiB
NUMA node0 CPU(s):                  0-11
lscpu doesn’t give us the main memory details since it’s solely focused on the
CPU, of which the caches are part of. From its man page: “lscpu gathers CPU
architecture information from sysfs, /proc/cpuinfo and any applicable
architecture-specific libraries (e.g. librtas on Powerpc)”.
There’s also a bit of discrepancy between the size of the L1 & L2 caches as
reported by lscpu (L1: 192KB, L2: 1.5MiB) and those reported by lstopo (L1:
32KB, L2: 256KB). It’s easy to see where this difference comes from: since we
have 6 cores and L1 and L2 caches are private to each core, lscpu by default
sums them up (192 = 32 * 6, 1.5 ≈ 0.256 * 6).
For the address sizes, we see that there are two kinds of addresses: physical and virtual addresses. Every byte of main memory has an address (i.e. the memory is byte-addressable). That address is what’s called the physical address. Main memory is then divided into physical pages. With 39 bits of physical addressing, we can address up to 512 GB of main memory.
We’ve also got 48 bits of virtual addressing which can address up to 256 TB of virtual memory. Virtual memory is also divided into pages and any virtual page can be held in any physical memory page (i.e. as a cache in virtual memory systems, physical memory is fully associative). Since virtual addresses are stored in 64 bits, if needed we can use the extra 16 bits to store all kinds of stuff as detailed in this blog post: Storing data in pointers. Computer systems use virtual addresses that are translated to physical addresses for 2 key reasons:
- Process isolation: main memory has to be shared amongst multiple processes and with virtual addressing, each process’s view of memory is isolated from all others. A virtual address for process A might point to a given physical page at a given moment, and later on, that same page might be used by a different process B (A’s contents were swapped out). When the contents for process A are swapped in, they might be held in an entirely different physical memory page. If physical addressing were used, either process A would have to hold on to the same physical page for the entirety of its lifetime OR we’d have to figure out a way to update all of A’s pointers any time its contents are moved around in physical memory. With virtual addressing, we get both flexibility and isolation, any time there’s changes to where process A’s contents are held, we simply update its mappings of virtual to physical addresses.
- Support larger than memory workloads: The total amount of data a program deals with might exceed the available physical memory - with virtual addressing, physical memory instead serves as a cache on pages allocated on the disk and also those that are unallocated.
Of course there are more reasons.
Back to caches, for the caches, we can get extended information via the -C
flag:
> lscpu -C

NAME ONE-SIZE ALL-SIZE WAYS TYPE        LEVEL
L1d       32K     192K    8 Data            1
L1i       32K     192K    8 Instruction     1
L2       256K     1.5M    4 Unified         2
L3        12M      12M   16 Unified         3
Here’s what the columns mean, (from lscpu’s man page):
Available output columns for -C:
          NAME  cache name
      ONE-SIZE  size of one cache
      ALL-SIZE  size of all system caches
          WAYS  ways of associativity
          TYPE  cache type
         LEVEL  cache level
At the first level, L1 is split into the instruction cache L1i and the data cache L1d as an optimization. L2 and L3 are unified which means they can hold either/both code instructions and data.
Even though memory is byte addressable, it’s cached in L1, L2 and L3 as 64 byte blocks. While in the cache, the block plus additional metadata form a cache line.
As for associativity, let’s start defining a ‘fully associative cache’: this is a cache where any block can be held in any cache line. It’s the most flexible but also imposes the highest access costs (both in time taken and complexity of implementation). To reduce the cost, hardware designers divide caches into a given number of sets and each block can only be cached within a specific set. Hence the set associative caches. Every set has a fixed number of lines such that a cache with 8 lines per set will be referred to as an ‘8-way set-associative cache’. Given a fixed cache size, we can increase the number of lines per set which’ll result in better caching but that’ll also mean reducing the overall number of sets and increasing the lookup cost & complexity per set. This graph below (from Ulrich Drepper’s paper ‘What every Programmer Should Know About Memory’) demonstrates the result of increasing lines per set:
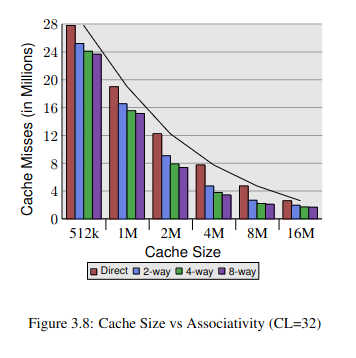
Another trade-off that’s worth pointing out is the size of the cache. From the graph above, we get the least amount of cache hits with the largest cache (16MB). However, it’s hard and expensive to make a cache that’s both large and fast, that’s why L1 is the smallest but also the fastest, L2 is between and L3 is the largest but slowest to access (though it’s still way faster than accessing memory).
Back to associativity: in my case, both L1i and L1d are 8-way set-associative: it seems direct-mapped caches are no longer used for L1. Direct-mapped caches are at the other extreme end of associativity in that there’s only 1 line per set - you get really fast access but that comes with much poor cache usage - if 2 blocks map to the same set, one will evict the other, but with a 2 way set, both can be cached sat the same time.
L2 is 4-way and L3 is 16-way set associative. I’m guessing they went with lower associativity for L2 based on the speed-associativity trade-off. With L3, it’s shared across all cores so it ought to have a higher associativity.
lshw #
Separately, we can use the lshw tool to get memory system details. From its man page: “lshw is a small tool to extract detailed information on the hardware configuration of the machine. It can report exact memory configuration, firmware version, mainboard configuration, CPU version and speed, cache configuration, bus speed, etc”.
Here’s the output from the lshw tool. I’ve formatted it into a table and omitted
some details, but to get raw results, e.g. for L1 cache, you can use the command
sudo lshw | grep '\*\-cache:0' -A 7
| description | L1 cache | L2 cache | L3 cache |
|---|---|---|---|
| physical id | d | e | f |
| slot | L1 Cache | L2 Cache | L3 Cache |
| size | 384KiB | 1536KiB | 12MiB |
| capacity | 384KiB | 1536KiB | 12MiB |
| synchronous | true | true | true |
| internal | true | true | true |
| write-back | true | true | true |
| unified | true | true | true |
I’m not quite sure what synchronous means, from the little I could gather online, it’s got something to do with the CPU’s clock frequency.
internal means the caches are directly within the CPU.
write-back means that if a data object is cached, any writes to it go solely to the cache and only when the block’s getting evicted is the memory updated. It’s faster than having to every write to memory even when you’re writing to the same location several times such as in a loop. All the caches are write-back. They’re also most likely write-allocate which means that before a data object is written to, it’s loaded into a cache line i.e. fetch-on-write.
lshw reports L1 as unified but that’s because it combines both L1i and L1d.
lshw also gives us the main memory details. From the output, the physical memory consists of two banks and each is based on the DDR4 standard which means it’s faster, provides higher bandwidth and consumes less power compared to previous iterations.
# truncated
> sudo lshw  | grep '\*\-memory$' -A 24

     *-memory
        *-bank:0
             description: SODIMM DDR4 Synchronous 2667 MHz (0.4 ns)
             size: 32GiB
             width: 64 bits
        *-bank:1
             description: SODIMM DDR4 Synchronous 2667 MHz (0.4 ns)
             size: 32GiB
             width: 64 bits
cpuid & TLB details #
I earlier mentioned that processes use virtual addresses which have to be translated into physical address. This could be done entirely in software by the operating system but it would be quite slow hence we need hardware support. As far as caching goes, we’ve got the Translation Lookaside Buffer (TLB) that caches mappings between virtual addresses and physical addresses.
Still, none of the tools we’ve used so far give us details on the TLB cache. On searching online, I got to the cpuid tool which can be used to retrieve the TLB details:
# downloading and using cpuid
> wget http://www.etallen.com/cpuid/cpuid-20230614.x86_64.tar.gz
> tar --strip-components=1 -xvf cpuid-20230614.x86_64.tar.gz
> ./cpuid  | grep 'CPU 0:' -A 613 > out.cpu0.cpuid
Its output is a lot (7000 lines in my case) since it prints the same details for every logical core with the exception of each core’s IDs. Therefore I’ll only focus on the output from a single core.
Here’s what I get for the TLB cache:
cache and TLB information (2):
   0x63: data TLB: 2M/4M pages, 4-way, 32 entries
         data TLB: 1G pages, 4-way, 4 entries
   0x03: data TLB: 4K pages, 4-way, 64 entries
   0x76: instruction TLB: 2M/4M pages, fully, 8 entries
   0xff: cache data is in CPUID leaf 4
   0xb5: instruction TLB: 4K, 8-way, 64 entries
   0xf0: 64 byte prefetching
   0xc3: L2 TLB: 4K/2M pages, 6-way, 1536 entries
Using getconf, my page size is 4KB so I’ll ignore the rest of the non-4KB values:
> getconf PAGESIZE
4096
| name | description | associativity | num entries (for 4K pages) |
|---|---|---|---|
| L1 DTLB | data TLB | 4-way | 64 |
| L1 ITLB | instruction TLB | 8-way | 64 |
| L2 TLB | unified TLB | 6-way | 1536 |
Each core has its TLB. We’ve got two levels of TLB caching (just like with L1 and L2). The higher levels are set-associative rather than fully-associative. This trend away from fully-associative L1 TLBs was detailed in [3]:
The small size of the L1TLB is often made up for by making the cache fully associative, with an LRU eviction policy. Recently, this cache has been growing in size and, in the process, was changed to be set associative.
The L1 ITLB has the highest associativity probably because code access patterns are more random due to layout plus all the libraries that have to be loaded.
Cache details from cpuid #
cpuid also outputs the cache details. We’ve already seen most of these:
| cache | L1d | L1i | L2 | L3 |
|---|---|---|---|---|
| type | data | instruction | unified | unified |
| self-initializing cache level | true | true | true | true |
| fully associative cache | false | false | false | false |
| system coherency line size | 64 | 64 | 64 | 64 |
| physical line partitions | 1 | 1 | 1 | 1 |
| ways of associativity | 8 | 8 | 4 | 16 |
| number of sets | 64 | 64 | 1024 | 12288 |
| inclusive to lower caches | false | false | false | true |
| complex cache indexing | false | false | false | true |
| size synth | 32 KB | 32 KB | 256 KB | 12 MB |
We’ve already encountered most of these attributes. Let’s go over new ones:
The self-initializing cache level attribute that’s true for all the caches means the caches can pre-populate themselves with data from a lower level - rather than solely relying on explicit instructions from the CPU in order to determine what exactly to cache (description from ChatGPT).
The system coherency line size and physical line partitions entries confirm that the cache line holds 64 bytes of data as a single indivisible block across all the cache levels.
The inclusive to lower caches entry is a bit odd since I expected it to be true for all the levels. Once more, from Ulrich Drepper’s paper (section 3.2):
To be able to load new data in a cache it is almost always first necessary to make room in the cache. An eviction from L1d pushes the cache line down into L2 (which uses the same cache line size). This of course means room has to be made in L2. This in turn might push the content into L3 and ultimately into main memory. Each eviction is progressively more expensive. What is described here is the model for an exclusive cache as is preferred by modern AMD and VIA processors. Intel implements inclusive caches where each cache line in L1d is also present in L2. Therefore evicting from L1d is much faster. With enough L2 cache the disadvantage of wasting memory for content held in two places is minimal and it pays off when evicting. A possible advantage of an exclusive cache is that loading a new cache line only has to touch the L1d and not the L2, which could be faster.
Seems for the current times Intel has opted to make L1 and L2 exclusive thus making loads faster but evictions slightly more expensive.
On a light note, cpuid also helpfully informs us that there isn’t an L4 cache hidden somewhere:
--- cache 4 ---
cache type                         = no more caches (0)
Et cetera #
cpuid provides other details that I won’t get into here. For example, you can use it to get info on which cache control commands your system supports or whether your cache coherence system system uses a snooping protocol (mine does) or even whether your system supports 5-level paging. Happy memory system exploring