Here’s the executive summary: if you’re looking for a dataset format to use (particularly with Arrow/Polars/DuckDB), choose parquet over CSV as it lends itself to faster computation and imposes less conversion overhead. Raw parquet can still take up a lot of space. Therefore, do consider Zstd for compression: it’s quite fast and provides high compression ratios, plus it’s built into DuckDB so you don’t need an external pre-processing step.
The problem with CSVs #
The formal introduction: Dataset formats are just as important as the database/data analysis tool used to derive insight. Usually you want a stable and widely universal format. From there, you then consider nice-to-haves such as size footprint and computation efficiency. CSV is ubiquitous and depending on how it’s generated, it can be stable. Additionally, one can quickly inspect CSVs using programs readily available on their computer - from simple text editors to web browsers. Since it’s text-based, you don’t even need external libraries to decode it - most languages’ standard libraries have CSV parsers and even if they don’t, you can get away with some simple string wrangling. So it’s no surprise that it’s the go-to format for the hard drive datasets that Backblaze releases each quarter.
However, CSVs have many shortcomings. Of the top of my head, I’d say they lack schema, definite types and direct support for nested values. For this post though, let’s focus on space and computation efficiency: raw CSVs take up a lot of space. The dataset released by Backblaze in the 1st quarter of 2023 takes up 7.1 GB but on getting gzipped it reduces to 782 MB.
> du -sh data_Q1_2023.zip
782M    data_Q1_2023.zip

> du -sh data_Q1_2023/
7.1G    data_Q1_2023/
Now, for some digression, let me dig a bit into the backblaze data. However, if you’re here strictly for the parquet and compression codec stuff, skip the next two sections.
Detour: Inspecting the backblaze dataset #
The dataset consists of a single file per day for January, February and March:
> ls -l data_Q1_2023/ | less
2023-01-01.csv
2023-01-02.csv
2023-01-03.csv
...
2023-03-29.csv
2023-03-30.csv
2023-03-31.csv
Let’s check the header of one of the csv files. head outputs the first part of
files, I’ve limited it to the first line (csv header). Since the columns have
been separated by commas, I’ve then replaced each occurrence of a comma with a
newline using tr. Finally, I’ve piped it to bat given that there are many
columns and I want to be able to page through the results (179 using
head -n1 2023-01-01.csv | tr , '\n' | wc -l to count).
[bat](https://github.com/sharkdp/bat) is a cat clone that I prefer since
it’s got automatic paging and syntax highlighting (also I’m obligated by the
“Rewrite It In Rust” task force to mention that it is in fact written in Rust).
> head -n1 2023-01-01.csv | tr , '\n' | bat

   1   │ date
   2   │ serial_number
   3   │ model
   4   │ capacity_bytes
   5   │ failure
   6   │ smart_1_normalized
   7   │ smart_1_raw
   8   │ smart_2_normalized
   9   │ smart_2_raw
:
The file has 235,597 rows:
> wc -l 2023-01-03.csv
235559 2023-01-03.csv
Let’s see the average number of rows per file.
All the lines sum up to 21,455,082. And since we’ve got 91 files, we end up with an average of 235,770 lines per file (Obviously I should subtract the headers).
# number of files
> files=$(ls -l | wc -l)
> echo $files
91

# number of lines
> lines=$(find . -name '2023-*.csv' -exec cat {} + | wc -l)
> echo $lines
21455082

# average
> python -c "print($lines/$files)"
235770.13186813187
DuckDB does provide the describe command that we could use as an alternative
for getting an overview of the csv’s schema.
> duckdb ':memory:' "describe select * from read_csv_auto('./2023-01-01.csv')"
   1   │ ┌──────────────────────┬─────────────┬─────────┬─────────┬─────────┬─────────┐
   2   │ │     column_name      │ column_type │  null   │   key   │ default │  extra  │
   3   │ │       varchar        │   varchar   │ varchar │ varchar │ varchar │ varchar │
   4   │ ├──────────────────────┼─────────────┼─────────┼─────────┼─────────┼─────────┤
   5   │ │ date                 │ DATE        │ YES     │         │         │         │
   6   │ │ serial_number        │ VARCHAR     │ YES     │         │         │         │
   7   │ │ model                │ VARCHAR     │ YES     │         │         │         │
   8   │ │ capacity_bytes       │ BIGINT      │ YES     │         │         │         │
   9   │ │ failure              │ BIGINT      │ YES     │         │         │         │
  10   │ │ smart_1_normalized   │ BIGINT      │ YES     │         │         │         │
  11   │ │ smart_1_raw          │ BIGINT      │ YES     │         │         │         │
  12   │ │ smart_2_normalized   │ BIGINT      │ YES     │         │         │         │
Next, let’s get a quick summary for a single CSV using DuckDB’s summarize.
Since I tend to use this query a lot with CSVs, I’ve wrapped it into a bash
function:
#!/usr/bin/bash

function csv_summarize() {
	duckdb ':memory:' <<-EOF
		summarize select *
		from
		read_csv_auto('$1')
	EOF
}
Usage:
> csv_summarize 2023-01-01.csv
   1   │ ┌──────────────────────┬─────────────┬──────────────────┬───┬────────────────┬────────┬─────────────────┐
   2   │ │     column_name      │ column_type │       min        │ … │      q75       │ count  │ null_percentage │
   3   │ │       varchar        │   varchar   │     varchar      │   │    varchar     │ int64  │     varchar     │
   4   │ ├──────────────────────┼─────────────┼──────────────────┼───┼────────────────┼────────┼─────────────────┤
   5   │ │ date                 │ DATE        │ 2023-01-01       │ … │                │ 235597 │ 0.0%            │
   6   │ │ serial_number        │ VARCHAR     │ 000a43e7dee60010 │ … │                │ 235597 │ 0.0%            │
   7   │ │ model                │ VARCHAR     │ CT250MX500SSD1   │ … │                │ 235597 │ 0.0%            │
   8   │ │ capacity_bytes       │ BIGINT      │ 240057409536     │ … │ 14000519643136 │ 235597 │ 0.0%            │
   9   │ │ failure              │ BIGINT      │ 0                │ … │ 0              │ 235597 │ 0.0%            │
  10   │ │ smart_1_normalized   │ BIGINT      │ 43               │ … │ 100            │ 235597 │ 0.21%           │
  11   │ │ smart_1_raw          │ BIGINT      │ 0                │ … │ 115853954      │ 235597 │ 0.21%           │
  12   │ │ smart_2_normalized   │ BIGINT      │ 70               │ … │ 134            │ 235597 │ 48.67%          │
Right off the bat, a couple of details worth noting:
serial_numberandmodelare all stringsfailureseems to be a boolean(0,1)- hmm, what does a -1
capacity_bytesmean? - a lot of the
smart_*columns are null (hence duckDB defaults to assigning them the data-type VARCHAR). However, when they have values, those are numerical and seem to be within the 0 - 200 range
It’s probably worth heading back to Backblaze’s info sections to get more details on the data + schema. Here’s what I got:
- the date is in the yyyy-mm-dd format, should be obvious.
- the serial number and model are assigned by the manufacturer.
- capacity is in bytes
- Once a drive is marked as failed (with “1”), its data is not logged anymore. A drive is considered ‘failed’ if it has totally stopped working or it’s show evidence of failing soon [3].
- the
smart_*columns are stats that each drive reports.
More digression: the SMART stat columns #
- From the Backblaze blog post [1], “SMART stands for Self-Monitoring, Analysis, and Reporting Technology and is a monitoring system included in hard drives that reports on various attributes of the state of a given drive.”
- SMART metrics are used to predict drive failures They are inconsistent from hard drive to hard drive, across different vendors and versions [3].
- Initially, Backblaze collected only subset of the SMART metrics daily but since 2014, they’ve been collecting all of them daily [3].
- Each SMART stat stands for some attribute. For example, Smart 1 is the “Read Error Rate” and Smart 193 is the “Load/Unload Cycle Count”. For the full list of what each value means, check the SMART Wikipedia entry
- Backblaze engineers narrow in on the following SMART values:
- Reallocated Sectors Count (SMART 5): From wikipedia: “Count of reallocated sectors. The raw value represents a count of the bad sectors that have been found and remapped… a drive which has had any reallocations at all is significantly more likely to fail in the immediate months”. Raw values seem to range from 0 to 70,000, normalized values seem to range from 0 to 202?
- Reported Uncorrectable Errors (SMART 187): reads that could not be corrected using hardware ECC. Related? to SMART 195 (Hardware ECC Recovered) though SMART 195 is reported inconsistently across vendors and may increase even though no error has occurred [4]. Raw values seem to range from 0 to 120, normalized values range from 0 to 104. Any drive with a value above zero is scheduled for replacement. Most drives through out their lifetime report zero. The stat is reported consistently across different manufacturers [3]
- Command Timeout (SMART 188): From wikipedia: “The count of aborted operations due to HDD timeout. Normally this attribute value should be equal to zero”. Raw values range from 0G to 104G (Not quite sure what the G unit means). Normalized to 100? (Does this mean any value greater than zero is normalized to 100, I’m not quite sure)
- Current Pending Sector Count (SMART 197): From wikipedia: “Count of “unstable” sectors (waiting to be remapped because of unrecoverable read errors). If an unstable sector is subsequently read successfully, the sector is remapped and this value is decreased”. The Wikipedia entry has more details. Raw values range from 0 to 1600. Normalized to 90-400?
- Uncorrectable Sector Count (SMART 198): From Wikipedia: “The total count of uncorrectable errors when reading/writing sector. A rise in the value of this attribute indicates defects of the disk surface and/or problems in the mechanical subsystem”. Raw values range from 0 to 16, normalized from 90 to 400.
- Power Cycle Count (SMART 12) - number of times the power was turned off and turned back on - Correlates with failure but Backblaze does not use it since it might not be the case that cycling the power directly causes failure; power cycles occur infrequently. Maybe it’s the pod? or “new drives have flaws that are exposed during the first few dozen power cycles and then things settle down” [3]. There’s the raw value (ranges from 0 up to 91 with most drives having a value of less than 26), and the normalized value (in which 1 - worst, up to 253 - best). The normalized value is not useful [3].
- Read Error rate (SMART 1): From wikipedia: “The raw value has different structure for different vendors and is often not meaningful as a decimal number”. Zero indicates drive is OK, any value large than zero indicates there might be a failure but the larger the value doesn’t mean failure is more probable.
- However Backblaze only uses the first 5 SMART values (5,187,188,197 and 198) to check for failure: whenever any of these is greater than zero, a drive is examined and in combination with other factors, its determined whether the drive has/is going to fail or not. More details in [1].
- Except for SMART 197, all other SMART stats tracked are cumulative.
- One thing I’m curious of: who does the normalization of values (is it the vendor, or the tools used to collect the SMART stats or Backblaze), and what is the procedure. I’ll definitely be digging into it more as I do the data analysis thingy with the dataset
Conversion from CSV to Parquet #
All’s good so far but I’m not quite keen on the dataset taking up all that disk space. Plus I’ll be downloading from the other quarters so it’ll only get worse. Time to switch formats. Given that I’ll be using DuckDB heavily, the best option for now is Parquet which they support out of the box. I’ll get to the best option for the future soon enough.
PyArrow makes conversion of CSVs to Parquet quite easy albeit with some configuration to get the schema right (see why I wanted to get a hang of the dataset first). Here’s the entire code for converting to parquet:
import os
import re

import duckdb
import pyarrow as pa
import pyarrow.csv as csv
import pyarrow.parquet as pq


ranges = [ (1, 5), (7, 13), (15, 18), (22, 24), (160, 161), (163, 184),
        (187, 202), 206, 210, 218, 220, (222, 226), (230, 235), (240, 242),
        (244, 248), (250, 252), (254, 255),
]

def smart_col_names(ranges):
    for v in ranges:
        if type(v) == int:
            start = v
            end_inclusive = v
        else:
            # else is tuple, unpack
            start, end_inclusive = v
        for n in range(start, end_inclusive + 1):
            yield f"smart_{n}_normalized"
            yield f"smart_{n}_raw"

smart_fields = ((name, pa.uint64()) for name in smart_col_names(ranges))
convert_options = csv.ConvertOptions(
    column_types={
        "failure": pa.bool_(),
        **{name: col_type for name, col_type in smart_fields},
    }
)

csvs_dir = "raw/data_Q1_2023"
outputs_dir = "output"
pattern = re.compile(r"\d{4}-\d{2}-\d{2}\.csv")
filenames = (
    f for f in os.listdir(csvs_dir) if pattern.match(f) is not None
)
compression_codec = "ZSTD"

for filename in filenames:
    filepath = os.path.join(csvs_dir, filename)

    # read csv
    tbl = csv.read_csv(filepath, convert_options=convert_options)

    stem = os.path.splitext(filename)[0]
    output_path = os.path.join(outputs_dir, f"{stem}.parquet")

    # write parquet
    pq.write_table(
        tbl,
        output_path,
        use_dictionary=["serial_number", "model"],
        compression=compression_codec,
    )
Of importance, I want the failure column to be set to boolean and all the
smart fields uint64. The compression codec used is Zstd. Overall, with
parquet + Zstd I end up at 556 MB, which is less than the gzipped CSVs while
being faster to compute on. You kinda have to use compression because for my
case, without it all the parquet size ends up at 7.7 GB.
Which compression codec to use with Parquet? #
PyArrow does offers the following codecs to use with Parquet:
- NONE (as in no compression)
- SNAPPY
- GZIP
- BROTLI
- LZ4
- ZSTD
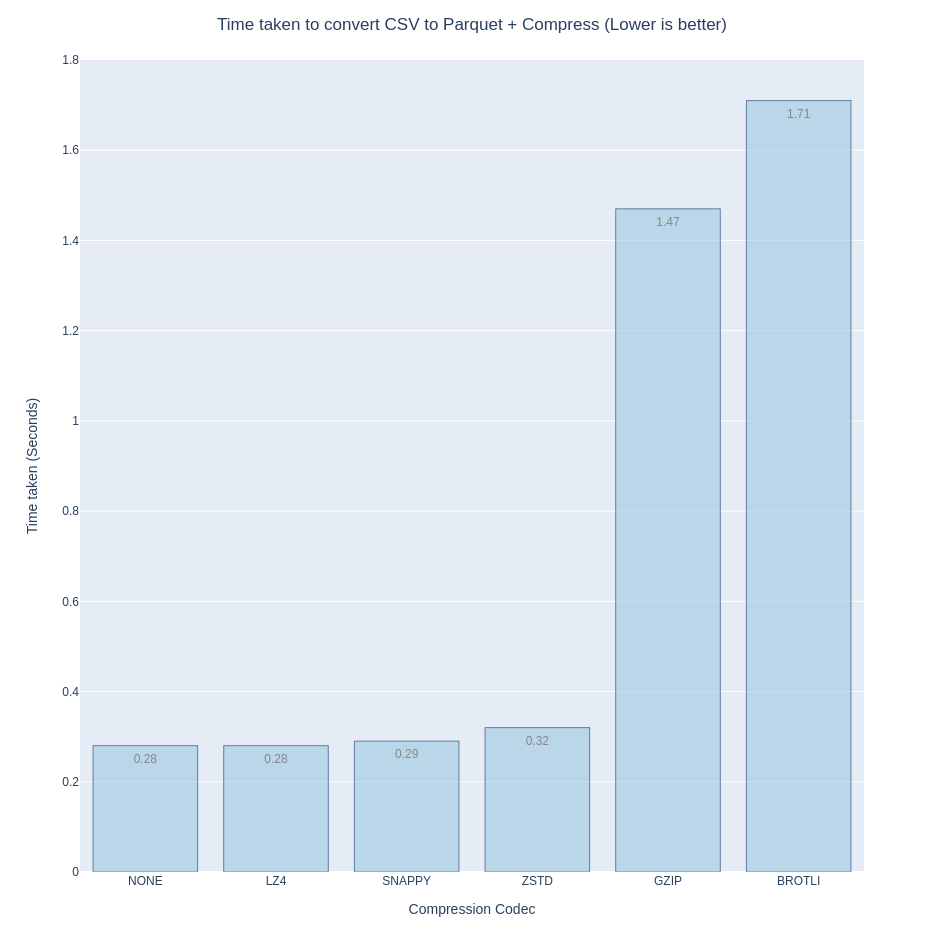
Before settling on ZSTD, I had to do some moonshine benchmarking. Of consideration was:
- speed
- compression ratio
- integration with stand-alone DuckDB, i.e. I don’t have to use PyArrow as an intermediary.
It’s worth noting that I’m relying on the default configurations that PyArrow uses; maybe some of these codecs would’ve performed better with different configs. PyArrow even goes so far as to allow for different codecs per column but that’s out of scope for now.
On speed, obviously having to do no compression is the fastest, but LZ4, Snappy are a close second followed by Zstd. Gzip and Brotli are relatively slow.
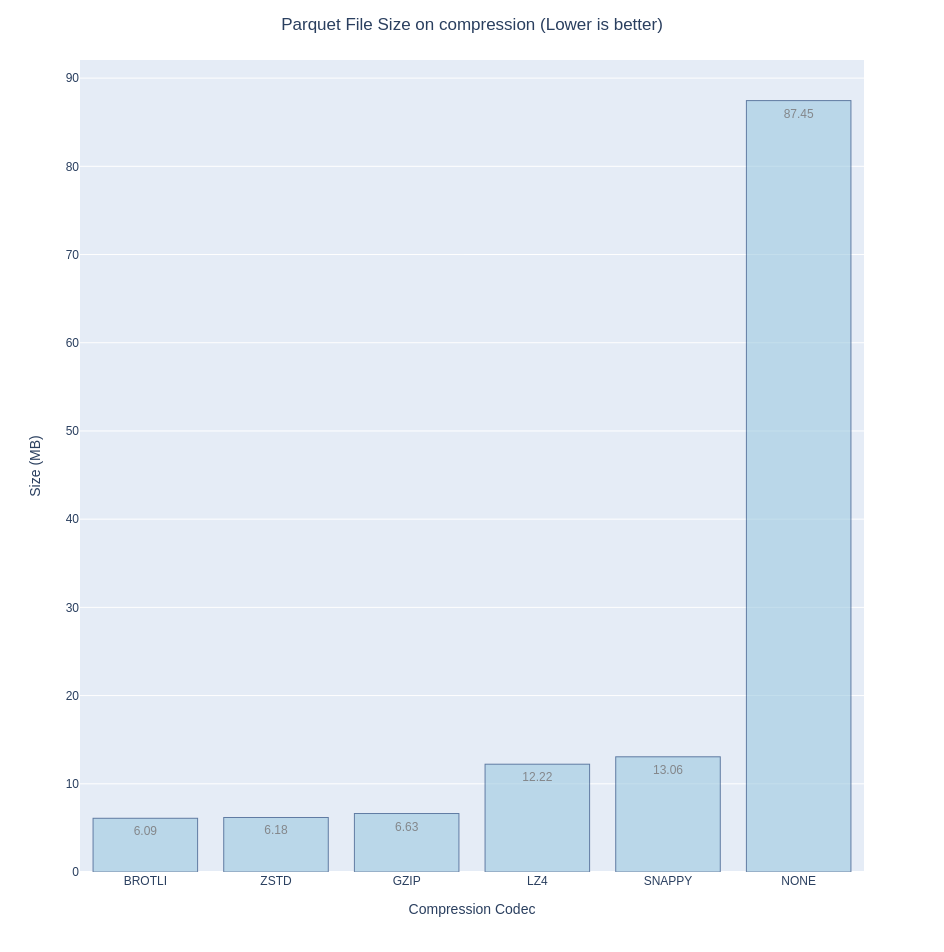
On the smallest disk footprint (compression ratio), Brotli offers the most bang for your back, closely followed by Zstd then Gzip. I’ve included ‘NONE’ in the bar chart just to show how necessary compression is.
Finally, on direct integration with DuckDB, (in that I don’t have to manually
decompress the dataset nor do I have to use an intermediary), my options are
pretty much narrowed down to snappy, zstd and gzip. Query speeds are similar (I
used the summarize query).
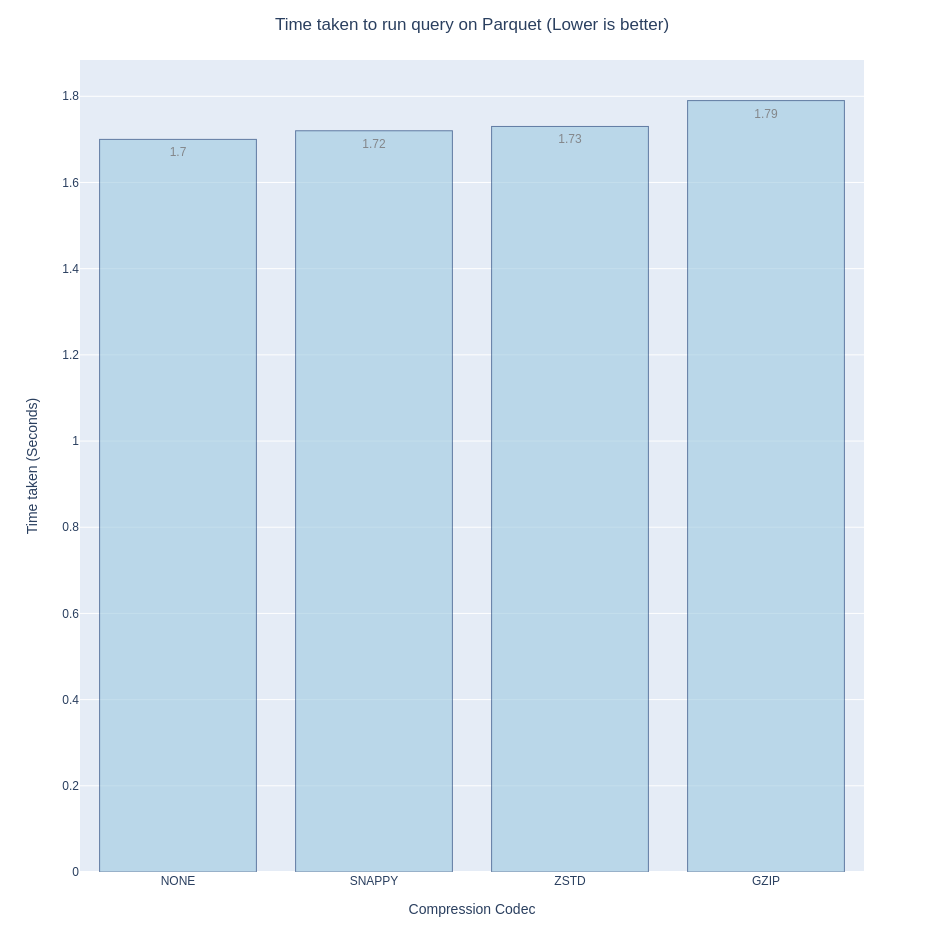
If it isn’t obvious by now, the only codec that ticks all the boxes is, drumroll please, Zstd.
The DuckDB format #
The DuckDB core team has been working on their own data format for a while. I mean, it’s already there everytime you persist a database to a file, it’s just not quite stable yet. And DuckDB does provide zero-copy conversion to Arrow and Polars, plus they have official libraries for almost all languages that I use, so I’m not too worried about downstream tools having scamper around to add support for their format once its stable.
I could list numerous reasons why I’m excited for a DuckDB-native format, but to avoid yet another digression let me limit it one: columnar compression. When you have more information about a value’s type and you’ve got them clustered together in columns, you can always do better than black-box compression in terms of space and speed. Additionally, for some methods and cases you don’t even need to decompress the data to compute over it. And that’s exactly what database and systems researchers and practitioners have been working on. For example, we now have the following:
- Integer compression (delta encoding, delta-of-delta, running-length encoding). See Time-Series Compression Algorithms, Explained from Timescale.
- Floating point compression (Gorilla-based and Chimp)
- Integer Set compression: Roaring Bitmaps and Tree-encoded Bitmaps
- Dictionary Encoding for categorical data (already available in Parquet)
- FSST compression for strings.
- JSON Tiles - it does not directly compress JSON but it columnarizes JSON which then allows for relatively better compression.
As detailed by one of the DuckDB co-creators in Lightweight Compression in DuckDB, a lot of these methods are making there way into DuckDB and being improved upon even further. So keep Parquet close by for now, but watch out for DuckDB’s format.
Backblaze Dataset References/Further Reading #
- What SMART Stats Tell Us About Hard Drives - Andy Klein - Backblaze
- The Shocking Truth — Managing for Hard Drive Failure and Data Corruption - Skip Levens - Backblaze
- Hard Drive SMART Stats - Brian Beach - Backblaze
- Self-Monitoring, Analysis and Reporting Technology - Wikipedia
- List of SMART stats - Backblaze
- Overview of the Hard Drive Data,